Global Warming – Extreme weather and other Pseudoscience
“Some are weather-wise, some are otherwise” – Benjamin Franklin
The UK media over recent years have constantly shown pictures of Extreme weather that have brought a degree of devastation to local communities and individuals. When it comes to flooding, this sensational reporting is usually statistically analysed on the amount of water that has fallen, and the wind speed achieved. From time to time, the phrase ‘since records began’ is strategically placed within sentences to reinforce and qualify the severity of the damage we are experiencing or the sub-divide the year into Wettest Summer, Winter, Spring or Autumn.
The reality is that the Meteorological Office that kept these records are based on daily records from 1914. Therefore, to describe any record-busting weather (such as 2012), gives a false view of the weather, which helps feed the ‘climate change’ lobby and a ‘political agenda that has dominated our politics for the last 20 years. Although the England and Wales Precipitation series, which measure rainfall and snow, actually goes back to 1766, and the Central England Temperature series, which covers the temperature from the south Midlands to Lancashire, is the longest-running record in the world, dating from 1659, these records are normally ‘overlooked’ as they are from amateur meteorologists and therefore, ignored.
Here is an extract from 2012 sky news online:
“England and Wales have seen the wettest summer for 100 years – according to MeteoGroup. Rainfall for June, July and August were 362mm (14.25in), making it the wettest summer since 1912. The average summer rainfall across the UK is 226.9mm (8.9in). MeteoGroup forecaster Nick Prebble said this summer is the fourth wettest since records began in 1727. The record for the UK’s wettest summer is 1912 when 384.4mm (15.1in) of rain fell.
The Met. Office said this summer is also likely to be one of the dullest on record, with just 399 hours of sunshine up to 28th August. This would make it the least sunny since 1980, when there were 396 hours of sun. The figures come after unsettled weather over the Bank Holiday weekend that left many UK parts with heavy rain and flood alerts.”
Sky News weather producer Joanna Robinson said: “It didn’t start well, with the wettest ever June, and the first half of July was very wet too. After that, the weather settled down a bit, but the end of August has been wet in places. This is because the jet stream position (a narrow band of fast flowing westerly winds high in the atmosphere) over the summer has allowed areas of low pressure to track across the UK, when they would typically be steered further north.”
The UK’s second wettest summer since 1912 was in 2007 when 357.8mm (14.09in) of rain fell. Of the three summer months, August looks set to be the driest and sunniest across the UK, with 105.5mm (4.15in) of rain to 29th August, according to the Met Office.
Shock, horror – wettest summer for seven years ago?
This must be clear proof that man-made climate change is taking hold – until you look closer at the statistics. For example, let’s take 2007 numbers, the second highest, in the annual precipitation charts. The summer was a statistical washout, but what about yearly rainfall for the year – if the media are correct, should it not be in the top ten all-time highs? Not even close coming in at number 17 in the past 100 years.
The reality is that rainfall has gone up and down quite constantly over the last 250 years, with the most concentrated levels of rain over ten years (which is a mere moment in our history) being in 1870 – 1880, given that between the two most extraordinary rainfall years 2007 and 2012, 2010 was the 11th driest in the last 100 years.
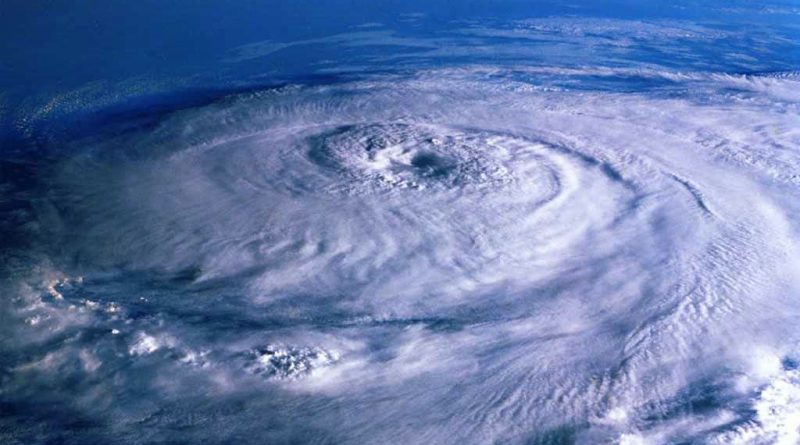
What about the winds and gales that are ‘changing the landscape’ of our coastline?
Well, again, history can tell another story. Few significant weather events in British history were as devastating as the ‘Grote Mandrenke’, “the great drowning of men,” which occurred in mid-January 1362. A massive south westerly gale originating in the Atlantic Ocean swept southern Ireland, Britain, Holland, Belgium, and Germany, causing 25,000 deaths. In addition, thousands of trees were blown down, and massive damage was caused to the few high buildings that existed in those times, notably churches with spires or towers were destroyed. Most famously, the wooden spire of Norwich Cathedral fell through its roof.
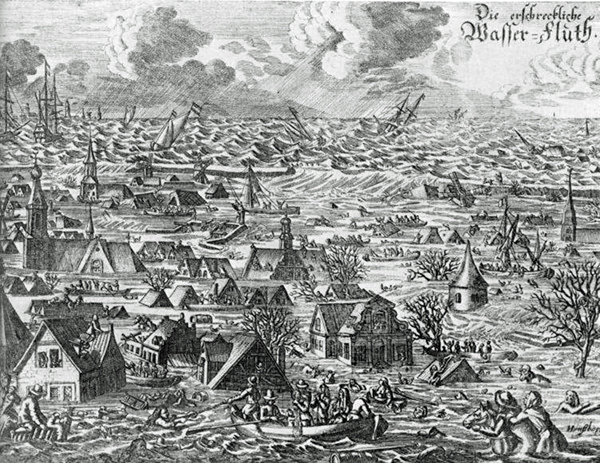
However, worse was to come. As the storm reached the North Sea, it combined with high tides to produce the phenomenon most feared by coastal communities, ‘The storm surge’ Ports all along the East coast of England and across the North Sea in Holland, Germany and Denmark, were destroyed, as the power of the wind and waters changed the shape of the European coastline forever.
However, this devastation is not as unusual as you would imagine and certainly not a ‘one-off off event’.
In the days going back to the first settlers in the Mesolithic period directly after the last ice age, our ancient ancestors had to contend with much more severe weather and harsher conditions. So how do we know this? It’s in the landscape of our countryside for all to see.
When the great melt started after the last ice age, about ten thousand years ago, the amount of water that fell on our land made the rainfall table look minuscule. The most significant amount of annual rainfall to fall on Britain over the last 250 years is 1300mm (52″); when the ice cap melted, 3.2 million millimetres (67,000 inches) swamped the landscape, flooding almost half the landmass we know today. Some of these waters ran down existing rivers like the Thames and made them ten times wider than today into the lower lands that would become the Irish and North Seas and the English Channel.
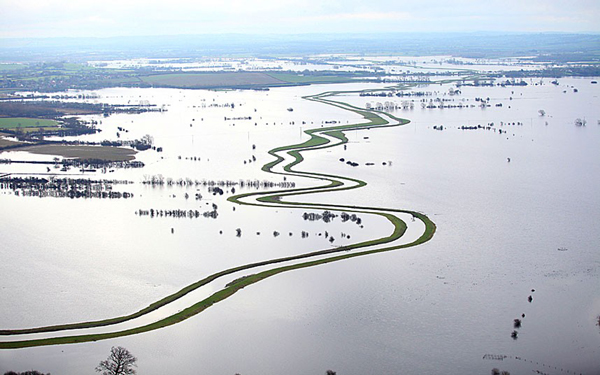
The process of this vast water cascading through our landscape created a network of riverbeds and flood plains, which we see flooding today, such as the Somerset flats. However, geology maps show that the sediments of sand, silt, and gravel below the topsoil are testament to these ancient paleo-river systems. This is why we see flooding occurring in only certain areas, which the environmental agencies call ‘flood plains’.
The Mesolithic people knew these flood plains well, so when they built their monuments such as Stonehenge and meeting places, they made them on the shorelines of these plains to use the flooded countryside to move from island to island on a boat.
What evidence is there of these flood plains of the past?
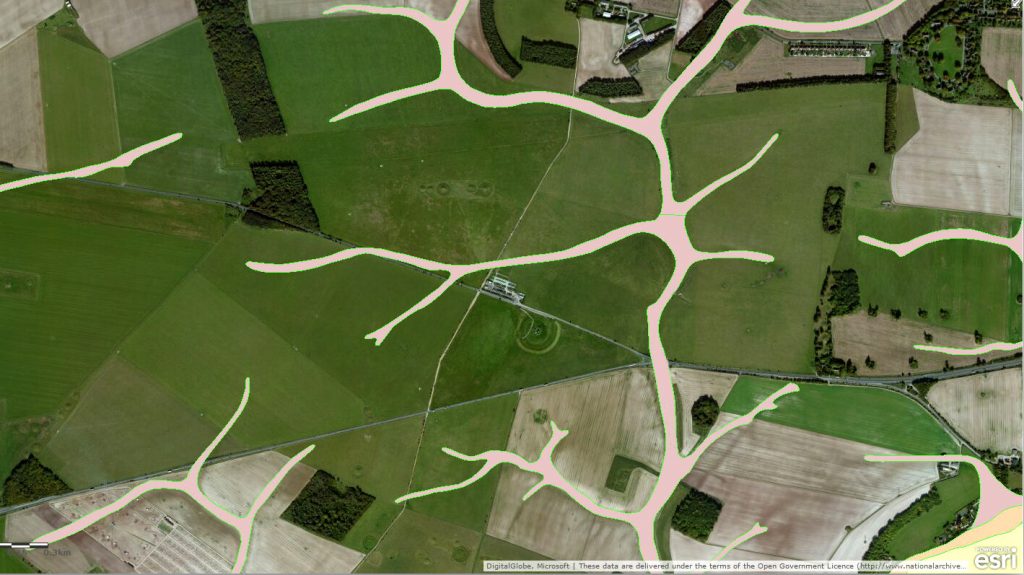
If you study any British Geological Society (BGS) map of Britain, you will notice it shows a series of bedrock, sedimentary and superficial deposits. At a scale of 1:50,000 km and below, these deposits start to form a labyrinth of material that look like canals and gigantic waterways, which lay under the surface on top of the bedrock. This lays testament to how the landscape must have looked at some stage of our natural history, and this is particularly prevalent in the Stonehenge area and other chalk bedrock outcrops.
These superficial deposits that resemble ancient rivers can be seen on the surface and are known to the archaeologists, geologists and the general public as ‘Dry River Valleys’ – because the river valleys are currently dry.
But this was not always the case!
Until recently, geologists believed that the contours of these chalk hills and valleys were cut during a ‘Periglacial Phase’ of the ‘Quaternary Period’, which is the current geological period that started about 2.6 million years ago – although there is no objective evidence of the exact date of their formation.
Theories (and in Geology, new ideas occur regularly) suggest that these dry river valleys result from water flooding, washing away the topsoils and rounding the chalk sub-soil during the melting period after an Ice Age.
The problem for archaeologists and geologists is – for there were several during the quaternary period?
Geologists seem content to give rough estimations on the construction date of geological objects such as dry river valleys, which for the archaeologist can become misleading. Nevertheless, the origins of these objects are of some interest, and the actual dates when humanity could have used them are even more critical if we understand the anthropological implications and, through this process, any archaeological findings concerning their locations.
We must try to understand why the dry river valleys were formed, but when LAST did they have water running within them?
Geological maps indicate great rivers once flowed through Britain, and we know that a tremendous deluge of water that has ever affected the landscape is at the end of an ice age, when the gigantic ice caps finally melted, at the end of the last ice age some 17,000 years ago, geologists have estimated that the ice was over two miles thick in some places. This substantial ice level MUST have created huge flooding all over the Mesolithic landscape, including the Valleys of the South Downs, even though they were over 100 miles away from the main ice sheet.
Modern geologists now accept that the dry river valleys are the product of water (not ice as previously believed), and looking at some extreme examples of the soil erosion and valleys cut, we are not talking about just tundra slowly melting in the summer seasons – but millions of gallons of fast-flowing water cutting away at the topsoil and sedimentary deposits, all the way down to the bedrock in some instances.
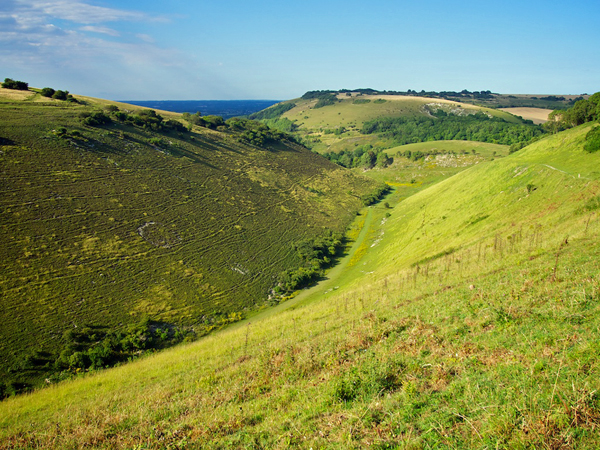
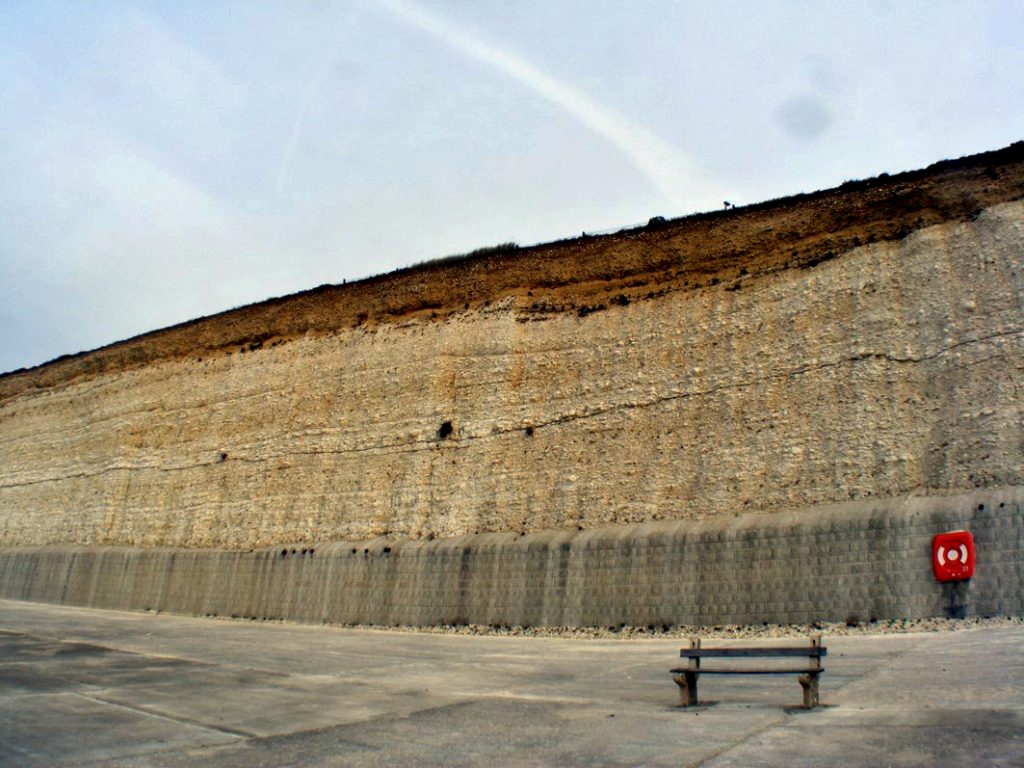
This geological evidence can be seen in the cliffs and valleys of the South Downs. Like the Stonehenge region, this area has the same chalk sedimentary bedrock and ancient post-glacial rivers. Evidence for these rivers is found by the subsoil consisting of sand, silt and clay. This subsoil can be seen in the valleys (known as deans) of the South Downs and most graphically in the exposed face of the chalky white cliffs that have been eroded by the sea, giving us a perfect ‘dissection’ of a typical prehistoric waterway. Modern geologists have yet to identify these huge concave sections of the cliffs; as being the remains of the ice melt from the last glaciation which had filled with water leaving the sandy sediments embedded in the chalky sedimentary rock face, just after the great melt, some 15,000 years ago, instead, they claim they are ‘windblown loess’ or ‘wash’ from the valley walls.
They can’t explain the relatively short distance from the sandy soil to today’s topsoil and the exact date of this sandy sediment. If you look closely at the cliffs, you will see the sandy remains of the river is touching the topsoil. If this dry river valley was as old as some archaeologists and geologists suggest – where is the rest of the topsoil?
If the topsoil erodes as quickly as some‚ experts’ also suggest – why is there 18 inches of topsoil on top of the chalk today?
There should be none, or are we expecting some massive climatic event to wipe away the topsoil shortly? Or is the dating of the prehistoric riverbeds and, consequently, dry river valleys totally incorrect? However, the evidence of flooding is not just down to the Geology; it can be seen in the construction of the ancient monuments our ancestors built, such as Woodhenge, by a strange-looking site called Durrington Walls.
For more information about British Prehistory and other articles/books, go to our BLOG WEBSITE for daily updates or our VIDEO CHANNEL for interactive media and documentaries. The TRILOGY of books that ‘changed history’ can be found with chapter extracts at DAWN OF THE LOST CIVILISATION, THE STONEHENGE ENIGMA and THE POST-GLACIAL FLOODING HYPOTHESIS. Other associated books are also available such as 13 THINGS THAT DON’T MAKE SENSE IN HISTORY and other ‘short’ budget priced books can be found on our AUTHOR SITE. For active discussion on the findings of the TRILOGY and recent LiDAR investigations that is published on our WEBSITE you can join our FACEBOOK GROUP.